
#9: Trip Atlas (beta)
Description:
Trip Atlas didn't start as an experiment in AI development. It started as a photographer preparing for a trip to several international cities — and running out of time with the research process.
The hours spent cross-referencing travel blogs, Reddit threads, Google Maps pins, and photography forums — all to answer one question: where should I actually go to shoot? That friction was the brief. The app was the answer.
Trip Atlas was conceived, ideated, and built to provide locations, descriptions, sample photos, geo-related data, access information, equipment recommendations, and nearby places to eat. It was used in the field during actual travel — the ultimate user test.
URL: https://www.tripatlas.app
The stack:
• AI engine: GPT-4o (OpenAI)
• Spot data: GPT-4o prompt output
• Geocoding: OpenStreepMap Nominatim
• Imagery: Google Places Photos API
***
• Origin: Claude Sonnet (original React file)
• UI: v0 by Vercel (after bake-off with Loveable)
***
• Hosting: GitHub
• Code Assist: Github Copilot
Early Ideation
The initial concept for Trip Atlas began in Claude Code, where the foundational architecture and feature set were defined through conversational AI development. The codebase was then ported into Vercel's v0 platform to leverage its UI generation capabilities and seamless deployment pipeline.
The first prompt:
Build an app listing the top 5–10 places to photograph in cities entered by the user, with maps, sample images, recommended times, equipment suggestions, and nearby food. Claude named it "Where to Shoot" and built the React file. The four seed cities: Edinburgh, Amsterdam, Barcelona, Dublin.
Core Screens Identified:
Landing page (logged-out state with Sign In / Create Account options)
Account creation via email authentication
Trip management page (list of user's trips)
Trip spots page (photography locations within each city)
Individual spots (details about each location, access requirements/hours, recommended equipment
Key Design Decisions:
No AI-generated imagery All sample images sourced from real photography APIs to maintain authenticity
Photographer attribution Every image displays proper credit to respect intellectual property
Image sourcing evaluation Compared Flickr API (requires commercial agreement, variable licensing) versus Google Places Photos API (pay-per-request at $7/1,000, location-specific results); selected Google Places for superior location relevance
POI identification accuracy Implemented validation to ensure photography spots return actual, visitable locations with correct coordinates and addresses
The first prompt in Claude Code
UI Bake-off: Loveable vs v0
To evaluate the best tool for rapid UI prototyping, parallel prompts and designs were created in both v0 and Loveable. This comparison focused on visual fidelity, component styles and quality, and alignment with the dark-themed photography aesthetic required for Trip Atlas.
Lovable's concept — named "Trip Muse" — came with a full design vision: "Polarsteps meets Google Travel. Dark theme with warm amber accents, high-contrast typography, subtle grain textures." Visually striking, full-bleed. v0 offered a more maintainable component-based system.
v0 won. The amber accent and dark theme survived.
Loveable concept
UI Revisions and functionality Iterations:
Ship, test, fix. Repeat.
Development progressed through multiple revision cycles, each informed by hands-on testing and design refinement.
Footer addition
Persistent footer with copyright, version badge, and About drawer — added for professional polish and app transparency.
Badge positioning
Archived badge moved from overlapping the 3-dot menu to left-aligned on trip cards — eliminating a UI collision that wasn't visible until testing.
Privacy messaging
"You will not be spammed" added to auth screens. A single line of copy that meaningfully reduced friction at account creation.
Skeleton loader
Replaced a "Location not found" flash with a skeleton loading state. Perceived performance improved significantly without changing actual load time.
Button clarity
"Add Spot" became "Add a custom spot" — a small copy change that eliminated user confusion about what the action would do.
“About” drawer interaction with v0
A/B Comparison: Tab vs List approach
A toggle-based compare tool was implemented to be able to evaluate two different information architecture approaches for displaying trip content. The Tab approach, originating from the Loveable design exploration, was compared against a traditional List approach.
Ultimately, the Tab approach was selected for the current implementation, providing a cleaner mobile experience while maintaining desktop usability.
Tab approach
Cities displayed as horizontal tabs
Spots shown in grid below selected city tab
Compact, app-like navigation feel
Better for users with few cities per trip
List approach
Cities displayed as expandable sections
All content visible through vertical scrolling
More traditional web pattern
Better for users wanting full trip overview
"The relative speed of the UI design from v0 — and some of the pattern suggestions it put forward during iteration — genuinely surprised me."— The author
UAT process
A structured User Acceptance Testing (UAT) process was established to validate changes before deployment. This included systematic verification across affected screens and explicit rollback procedures when implementations didn't meet requirement
Troubleshooting with the Agent
UAT Protocol established:
- Agent performs UAT verification after each implementation
- Multi-location changes verified across all affected screens
- Explicit confirmation required before PR merge
Reported bugs and issues were identified and fixed, with explanations for each
"I had to keep purchasing credits mid-debug. Eventually I instructed the agent to roll back and phase the builds in — that was the real turning point." — The author
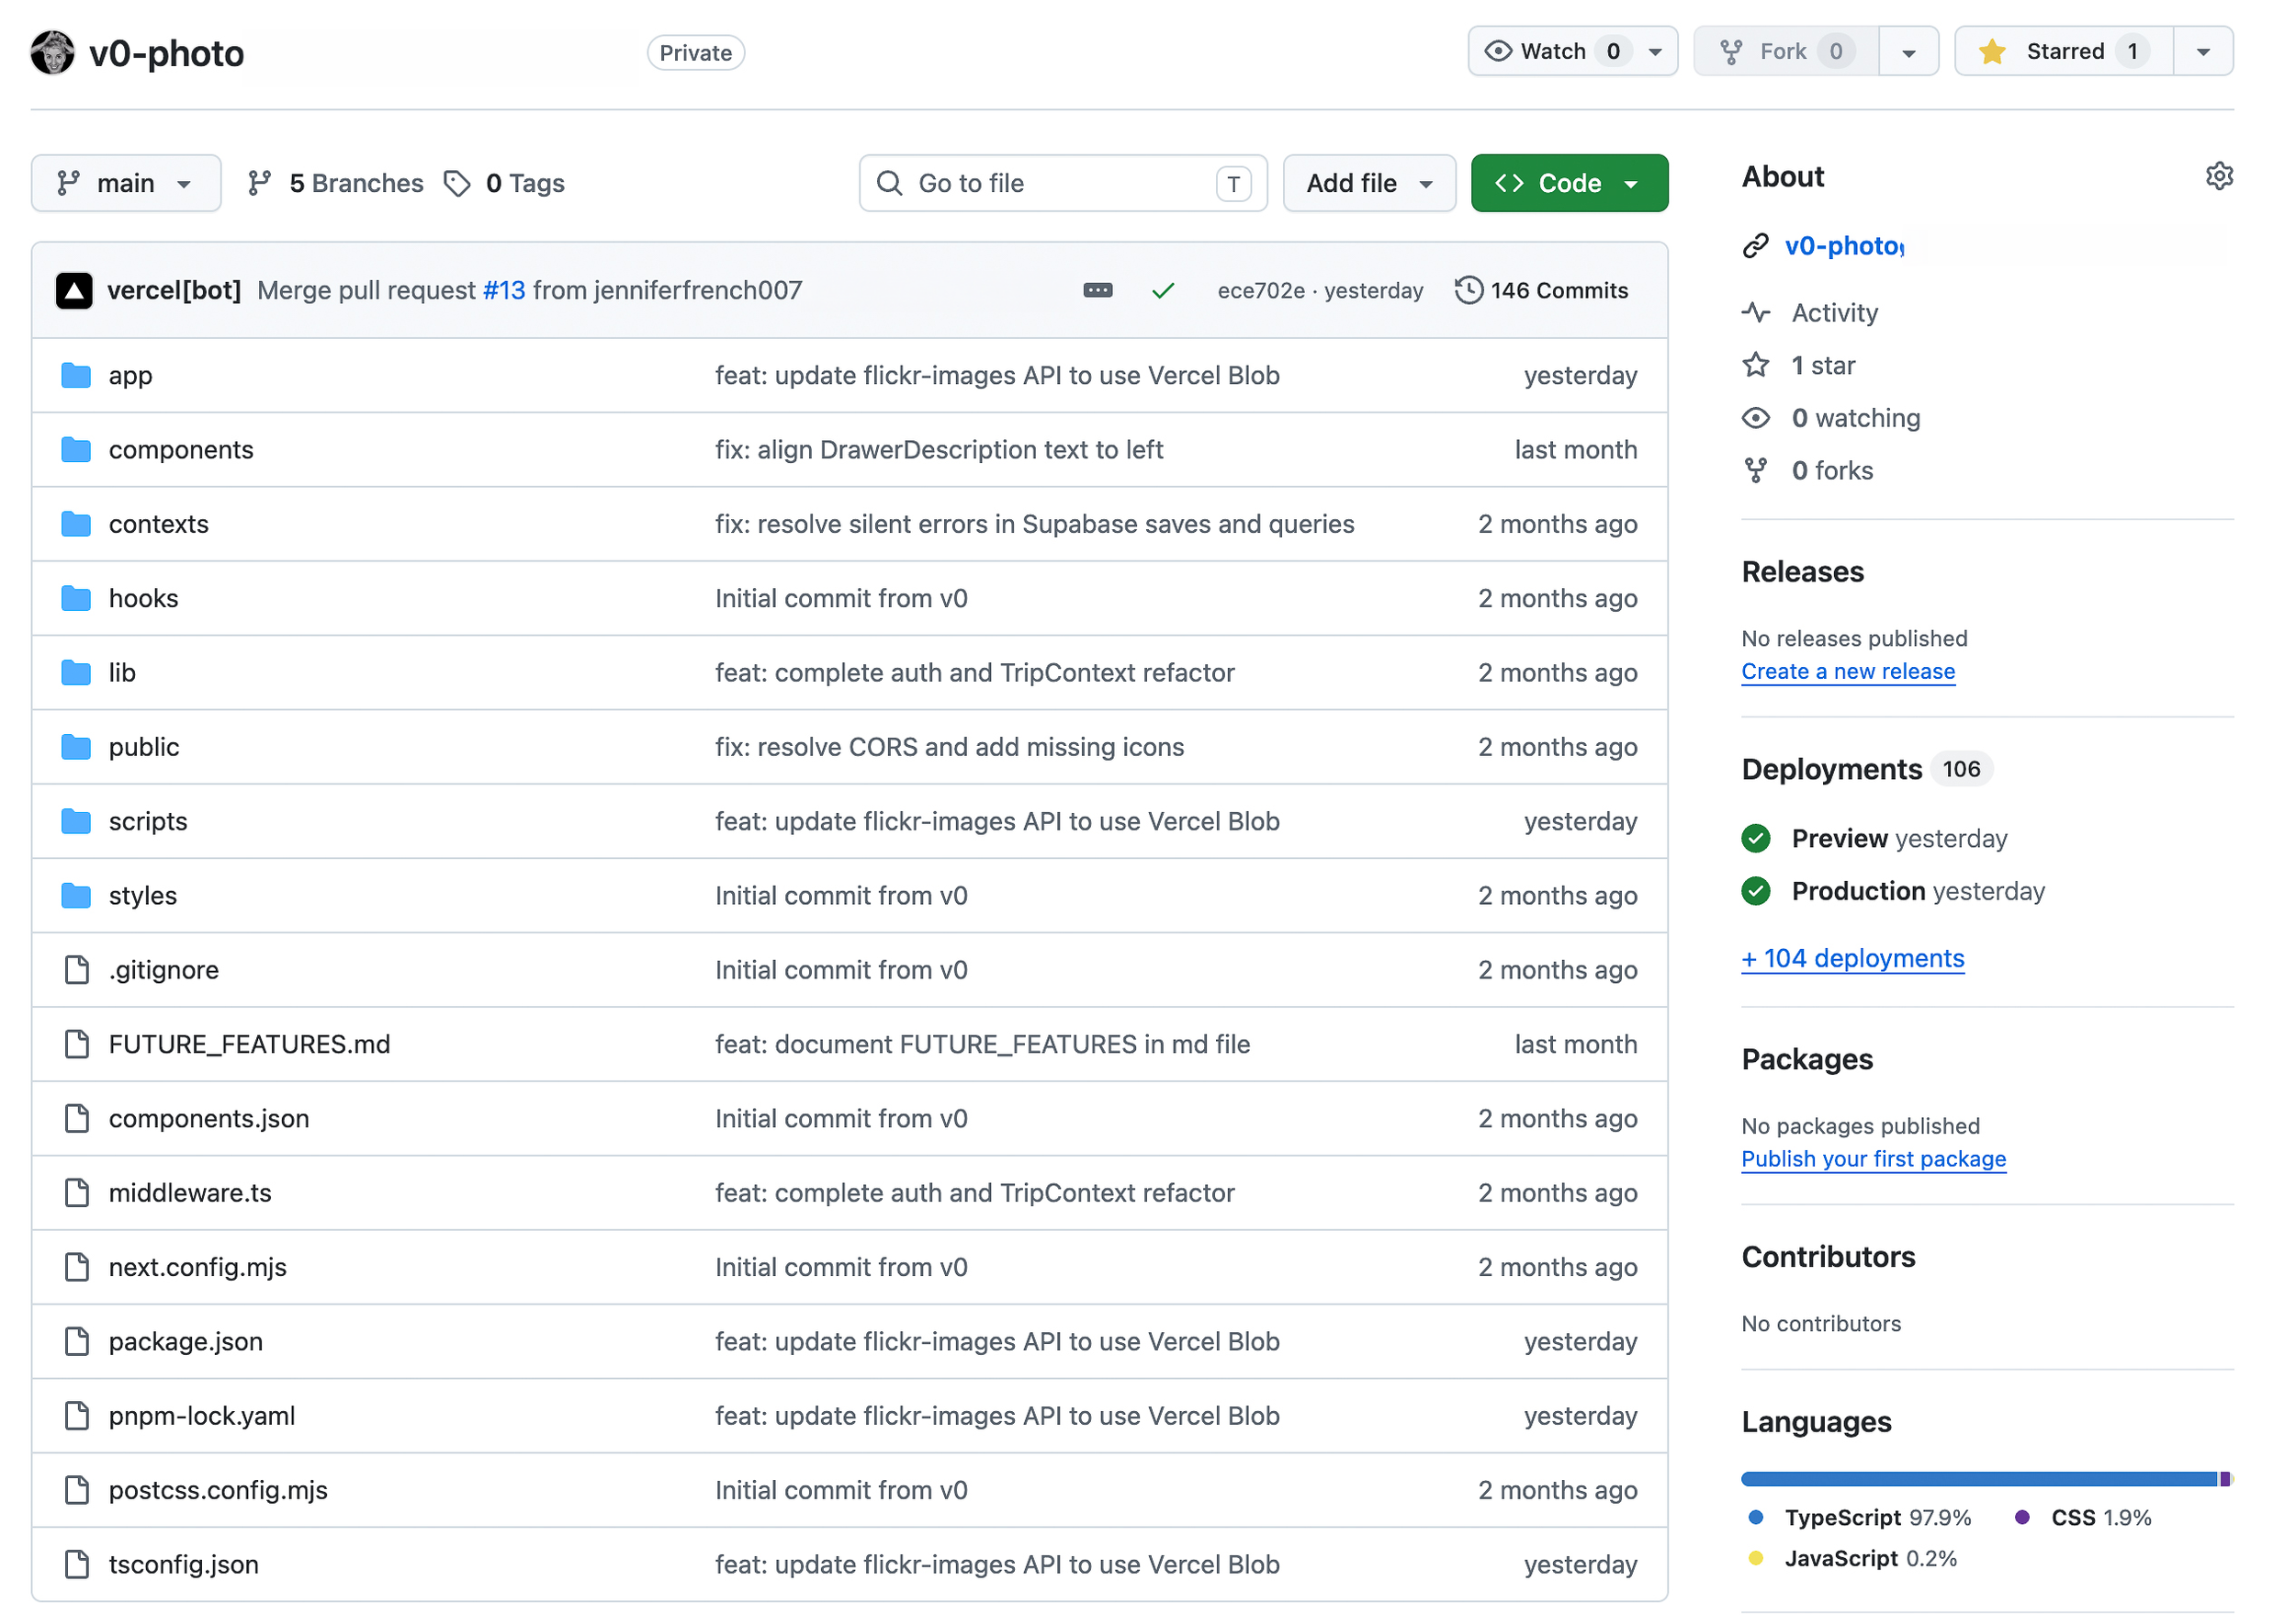
GitHub integration
Connecting the v0 project to GitHub required learning the workflow for exporting a v0-created project into a version-controlled repository. This enabled proper pull request workflows and collaborative development practices.
Process
Create repository in GitHub (v0-photxxx)
Connect v0 project to repository via Settings panel
Changes in v0 automatically push to a feature branch
Pull request created for review before merging to main
Branch naming convention: v0/xxx
This integration established a professional development workflow, allowing changes to be reviewed, tested, and merged systematically rather than deploying directly from the v0 environment.
Solving the Image Expiration Problem
During beta testing, a critical issue emerged: spot images stopped loading after several weeks. Investigation revealed that Google Places Photo API returns temporary URL references that expire quickly, rendering stored image URLs useless.
Problem discovery
Trip created in March 2026 showed broken images approximately 4 weeks later
Database contained valid-looking URLs, but Google had quietly expired the references
This affected all spots across all cities
Option 1: Refresh on view
Approach: Fetch new URL each time a spot is viewed
Trade off: Ongoing API costs; added latency
Option 2: Vercel Blob storage
Approach: Download and store actual images permanently
Trade off: One-time implementation, minimal ongoing cost
Option 3: Do nothing
Approach: Accept broken images
Trade off: Poor user experience
Chosen solution
Vercel Blob was selected for permanent image storage. The /api/flickr-images route was updated to download images from Google Places and upload them to Vercel Blob, returning permanent URLs. A migration script refreshed all 40 existing spots of the test trip: Edinburgh, Amsterdam, Barcelona and Dublin
Cost analysis
Storage: ~$0.02-0.25/month depending on scale
No ongoing API calls for image retrieval
Images never expire
Trip Atlas screens
Trip screen displays up to 10 locations with a description and address
Spot screen displays relevant information about the location
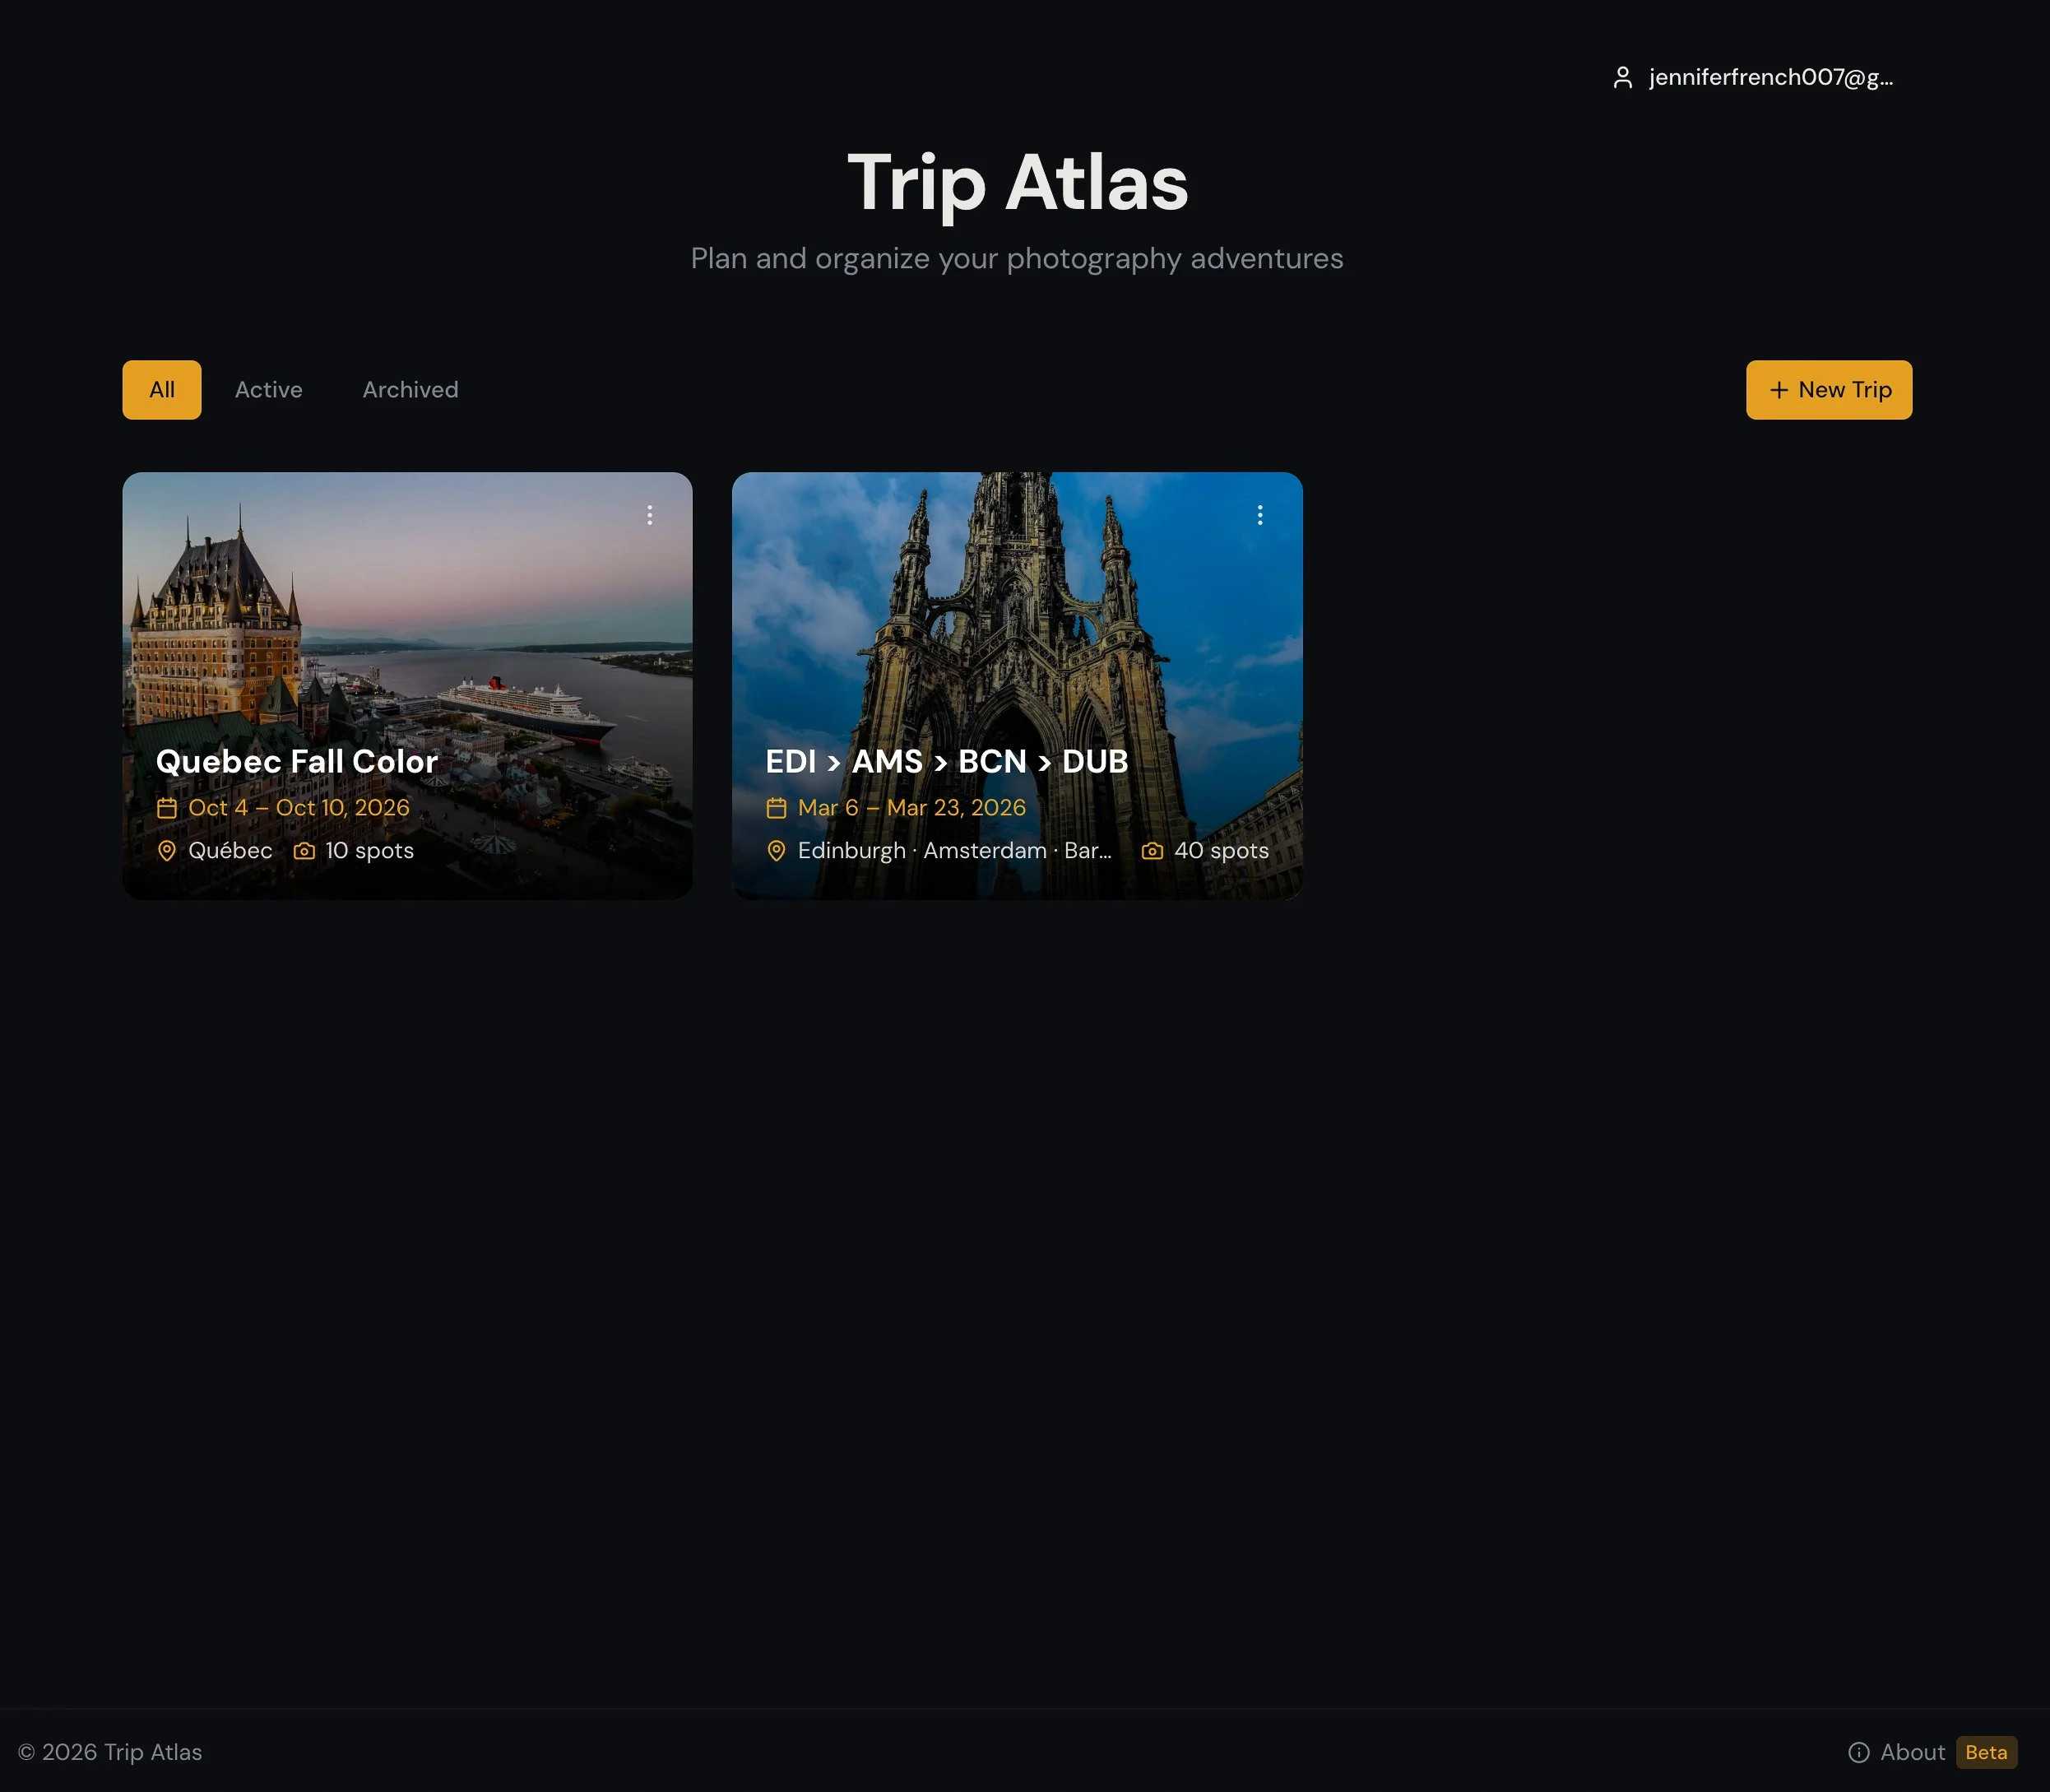
Landing screen with 2 photo trips
Building fast means the process disappears.
One of the unexpected costs of building at AI speed: moving too fast to document what what I was thinking. The case study came after the build — which means a lot of the in-the-moment reasoning had to be reconstructed from chat logs and commit messages.
This isn't a failure of process. It's a feature of the medium. When iterating at the pace Gen AI makes possible, reflection is the thing that falls away the easiest. The work moves faster than the meta-awareness of the work itself.
Now multiply that across several agents, each handling a separate task — one writing code, one generating UI, one managing version control, one sourcing images. Each conversation its own context, its own decisions, its own dead ends. The process doesn't just disappear once. It disappears in parallel.
150+ Github Commits
Each commit is a decision made quickly in order to determine success or rework.
100+ Builds & Deployments
Ship, test, break, fix, — Buy credits. Restart. Repeat. The rhythm of AI-assisted design and development
v115 when credits run out
Mid-debug. The agent stopped. Credits purchased. Work continued.
A lesson for anyone building in this era: decide early whether you're making a product , a proof of concept, or a case study. If it's important, you need to slow down enough to capture the thinking — because the tools won't do it for you. At v115, mid-debug, with credits running out, nobody is writing field notes.
What building Trip Atlas with Gen AI taught me
Make the agent plan before it builds
Prompt the agent to create the plan before it builds. Confirm it understands the prompt. It’s okay to give the agent the scope or goal of what you envision, but building it all at once can lead to unnecessary churn and rollbacks.
Ask the agent to articulate process or task flows to find the gaps.
Before committing to a screen by screen flow, ask the agent to articulate it, like a written script. This way you can see what the agent is considering before you get into the actual screens. This can help find gaps in the process or uncover states not yet considered.
UAT after every build, before every push
Instruct the agent to conduct UAT immediately after implementation — before the PR is created, before anything merges. Bugs caught at the build level cost tokens. Bugs caught after deployment cost time, trust, and sometimes a full rollback.
Your taste, your empathy, your humanity — these are what the agent can't replicate.
Yes, AI is fast and efficient. Its quiet easy to test ideas quickly and either keep and discard. But that doesn’t mean what AI built is correct. Yes, it executed a prompt, but is it useful and usable? Is it visually appealing and WCAG compliant? Only real people can make that determination.
"At the end of the day it reminds me of a Rube Goldberg machine — levers and pulleys, give and take, and the learning happens somewhere in the chain reaction." — The author
Future roadmap
Trip Atlas is currently in beta with several planned enhancements to expand functionality and improve user experience.
Route Planning & Optimization
The most ambitious planned feature enables users to build an optimal route for visiting photography spots within a city. Users select their starting location (hotel or accommodation), choose which spots to visit, and pick a transport mode (walk, drive, or public transit). The app then calculates the most efficient path between spots, factoring in travel time and optimal photography conditions like golden hour and blue hour. Start time recommendations help photographers arrive at each location when lighting conditions are ideal.
Offline/PWA Mode
A Progressive Web App implementation using Serwist (service worker) and IndexedDB will enable users to access their trip data without internet connectivity. This is particularly valuable for travelers accessing their itinerary in areas with limited connectivity.
Print & Download Itinerary
Users will be able to print or download their trip itinerary as a clean, ink-friendly PDF. The output will include trip name, dates, cities, and for each spot: name, address, description, recommended times, and equipment suggestions.
Image Loading Optimization
Currently, each spot fetches 2 images from Google Places API. A "Load more photos" button will allow users to request additional images on demand, balancing visual richness against API costs ($7 per 1,000 requests).
Nearby Spots Discovery
While viewing an individual spot, users can optionally see additional photo-worthy locations within a configurable radius that didn't make the curated list. This feature is controlled by a user preference toggle, keeping the UI clean by default while giving photographers the option to discover bonus opportunities.